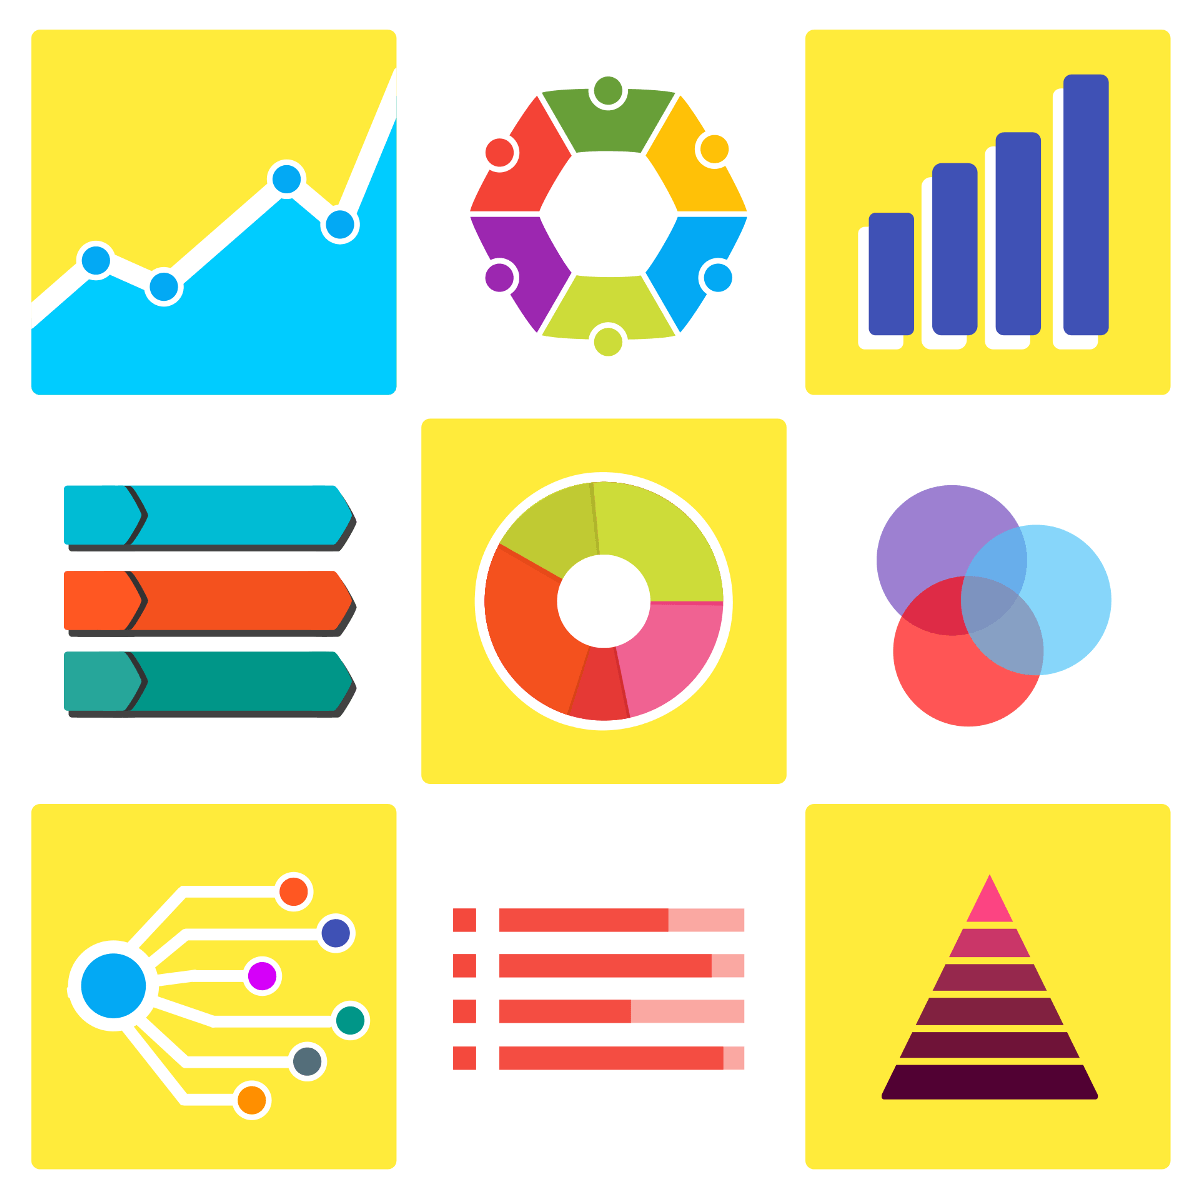
We’re living in an era where everyone can be a publisher. With the proliferation of the internet, anyone looking to start a new blog or online platform has more avenues to do so than ever before.
From blog posts to social media posts, there are never enough good ideas for content. That especially applies to infographics. Increasingly, visual content is gaining in popularity. It’s great for beginners since there’s less writing involved.
Also Read: 7 Ways and More to Increase Your Social Media Following
But how can you start creating your own charts and graphics? Read on to find out how different types of infographics can fit into your marketing strategy.

1. Timeline Infographic
Timeline Infographic is a visual representation of sequential events or facts that occur over time in a graphically attractive manner. It is one of the most popular types of infographics used in digital marketing. It allows users to visualize a timeline of events quickly and easily.
It can be used to show the chronological order of product launches, historical events, or yearly progress. This infographic can also be used to showcase the timeline of a particular campaign or project.
It helps to provide a comprehensive overview of a company’s journey or to showcase the accomplishments of an individual, organization, or business. And it serves as a powerful means to tell a story in a uniquely engaging way.
2. Process Infographic
They can help viewers understand the steps taken in order to achieve a specific goal. This type of infographic typically uses a flow chart with text and images to break down each step in the process. Using colors and icons can help make the process easier to understand and more visually appealing.
You can use process infographics to educate viewers about the different steps in a campaign, from strategy to implementation. It can be used to show the audience how their input affects the bigger picture, highlighting both successes and difficulties faced along the way. And it can help break down complex processes into easy-to-understand pieces.
3. Informational Infographic
You can use a variety of different types of informational infographics. An interactive infographic is a great way to engage your audience as it allows them to explore the data and explore relationships. A timeline infographic can help break down processes or events into simple, easy-to-follow steps.
If you need to present data in comparison, a comparison infographic would be a good choice. If your goal is to highlight trends and correlations, a data-driven infographic can convey the message clearly.
And a process infographic is a great way to demonstrate a complex procedure in a concise manner. With the right type of infographic, you can present your data in an interesting and effective way, while driving engagement and boosting sales. If you want to learn more about infographic design and don’t know where to get help, you can click to create your own-for-free or other reputable websites.
Learning the 3 Types of Infographics You Can Use in Your Marketing
Utilizing the different types of infographics in your marketing campaigns can give your content the extra boost it needs to be memorable and stand out from the rest. They are versatile and can be tailored to fit any situation. They can be used to showcase data, explain a concept, or create an emotional connection with your audience.
Also Read: 5 Digital Marketing Tips to Convince Your Target Market
Try using an infographic for your next marketing campaign to make a lasting impression and drive your message home. Click here to see some great marketing infographics!
View some of our other writings. Many of our articles can be helpful to you.


